
Saudi non-oil export growth accelerated sharply in November 2025, signaling stronger trade diversification efforts. The Kingdom recorded notable gains despite global economic uncertainty. As a result, trade indicators showed improved balance and resilience.
Official data showed non-oil exports increased by 20.7 percent compared to November 2024. This rise reflected stronger international demand and improved logistics performance. Moreover, the data highlighted progress in reducing oil dependency.
Exports excluding re-exports grew by 4.7 percent during the month. Meanwhile, re-exported goods surged by 53.1 percent year-on-year. This sharp rise supported overall export performance and boosted trade activity.
Machinery and electrical equipment drove re-export growth. These goods expanded by 81.9 percent compared to last year. Notably, they accounted for more than half of total re-exports.
Total merchandise exports rose by 10 percent during November 2025. Petroleum exports also increased by 5.4 percent. However, oil’s share in total exports declined noticeably.
Petroleum exports represented 67.2 percent of total exports during the month. This marked a decline from 70.1 percent one year earlier. Consequently, non-oil trade gained greater relative importance.
Imports recorded a slight decline of 0.2 percent compared to November 2024. This decrease supported a stronger trade balance. As a result, the merchandise trade surplus surged by 70.2 percent.
The ratio of non-petroleum exports to imports reached 42.2 percent. This compared with 34.9 percent last year. Therefore, Saudi non-oil export growth contributed directly to stronger trade efficiency.
Machinery and electrical equipment led non-oil export categories. These products represented 24.2 percent of total non-oil exports. Additionally, their value increased by 81.5 percent year-on-year.
Chemical industry products ranked second among non-oil exports. They accounted for 20.3 percent of total non-oil shipments. However, their growth remained modest at 0.5 percent.
On the import side, machinery and electrical equipment dominated incoming goods. They represented 30.7 percent of total imports. Furthermore, their value rose by 8.6 percent annually.
Transport equipment ranked second among imported products. This category accounted for 14.4 percent of total imports. Its value increased by 2.2 percent during the period.
China remained the Kingdom’s largest trading partner. It accounted for 13.5 percent of total exports. The UAE and Japan followed closely.
Other key export destinations included India, South Korea, and the United States. Egypt, Singapore, Bahrain, and Poland also ranked highly. Together, these countries absorbed over 71 percent of exports.
China also led import sources, representing 26.7 percent of total imports. The United States ranked second, followed by the UAE. Several European and Asian countries completed the top ten list.
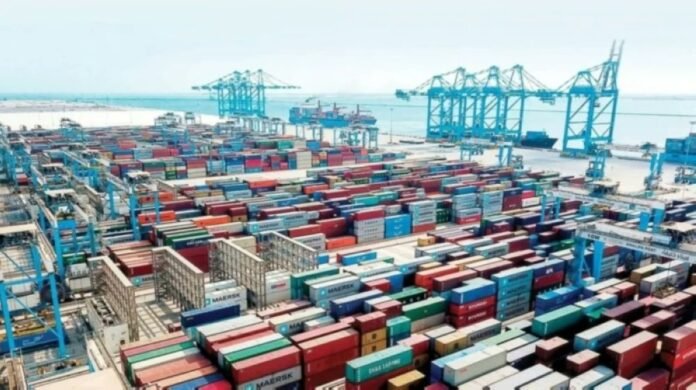
King Abdulaziz Port in Dammam led import entry points. Jeddah Islamic Port ranked second. Major airports also played critical roles.
For non-oil exports, King Abdulaziz International Airport topped the list. Several ports and airports followed closely. Collectively, they handled most outbound non-oil trade.
Overall, Saudi non-oil export growth reflects stronger competitiveness and improving trade infrastructure. The data reinforces diversification goals and long-term economic stability.